#1 AllianceNetworkPlot.py
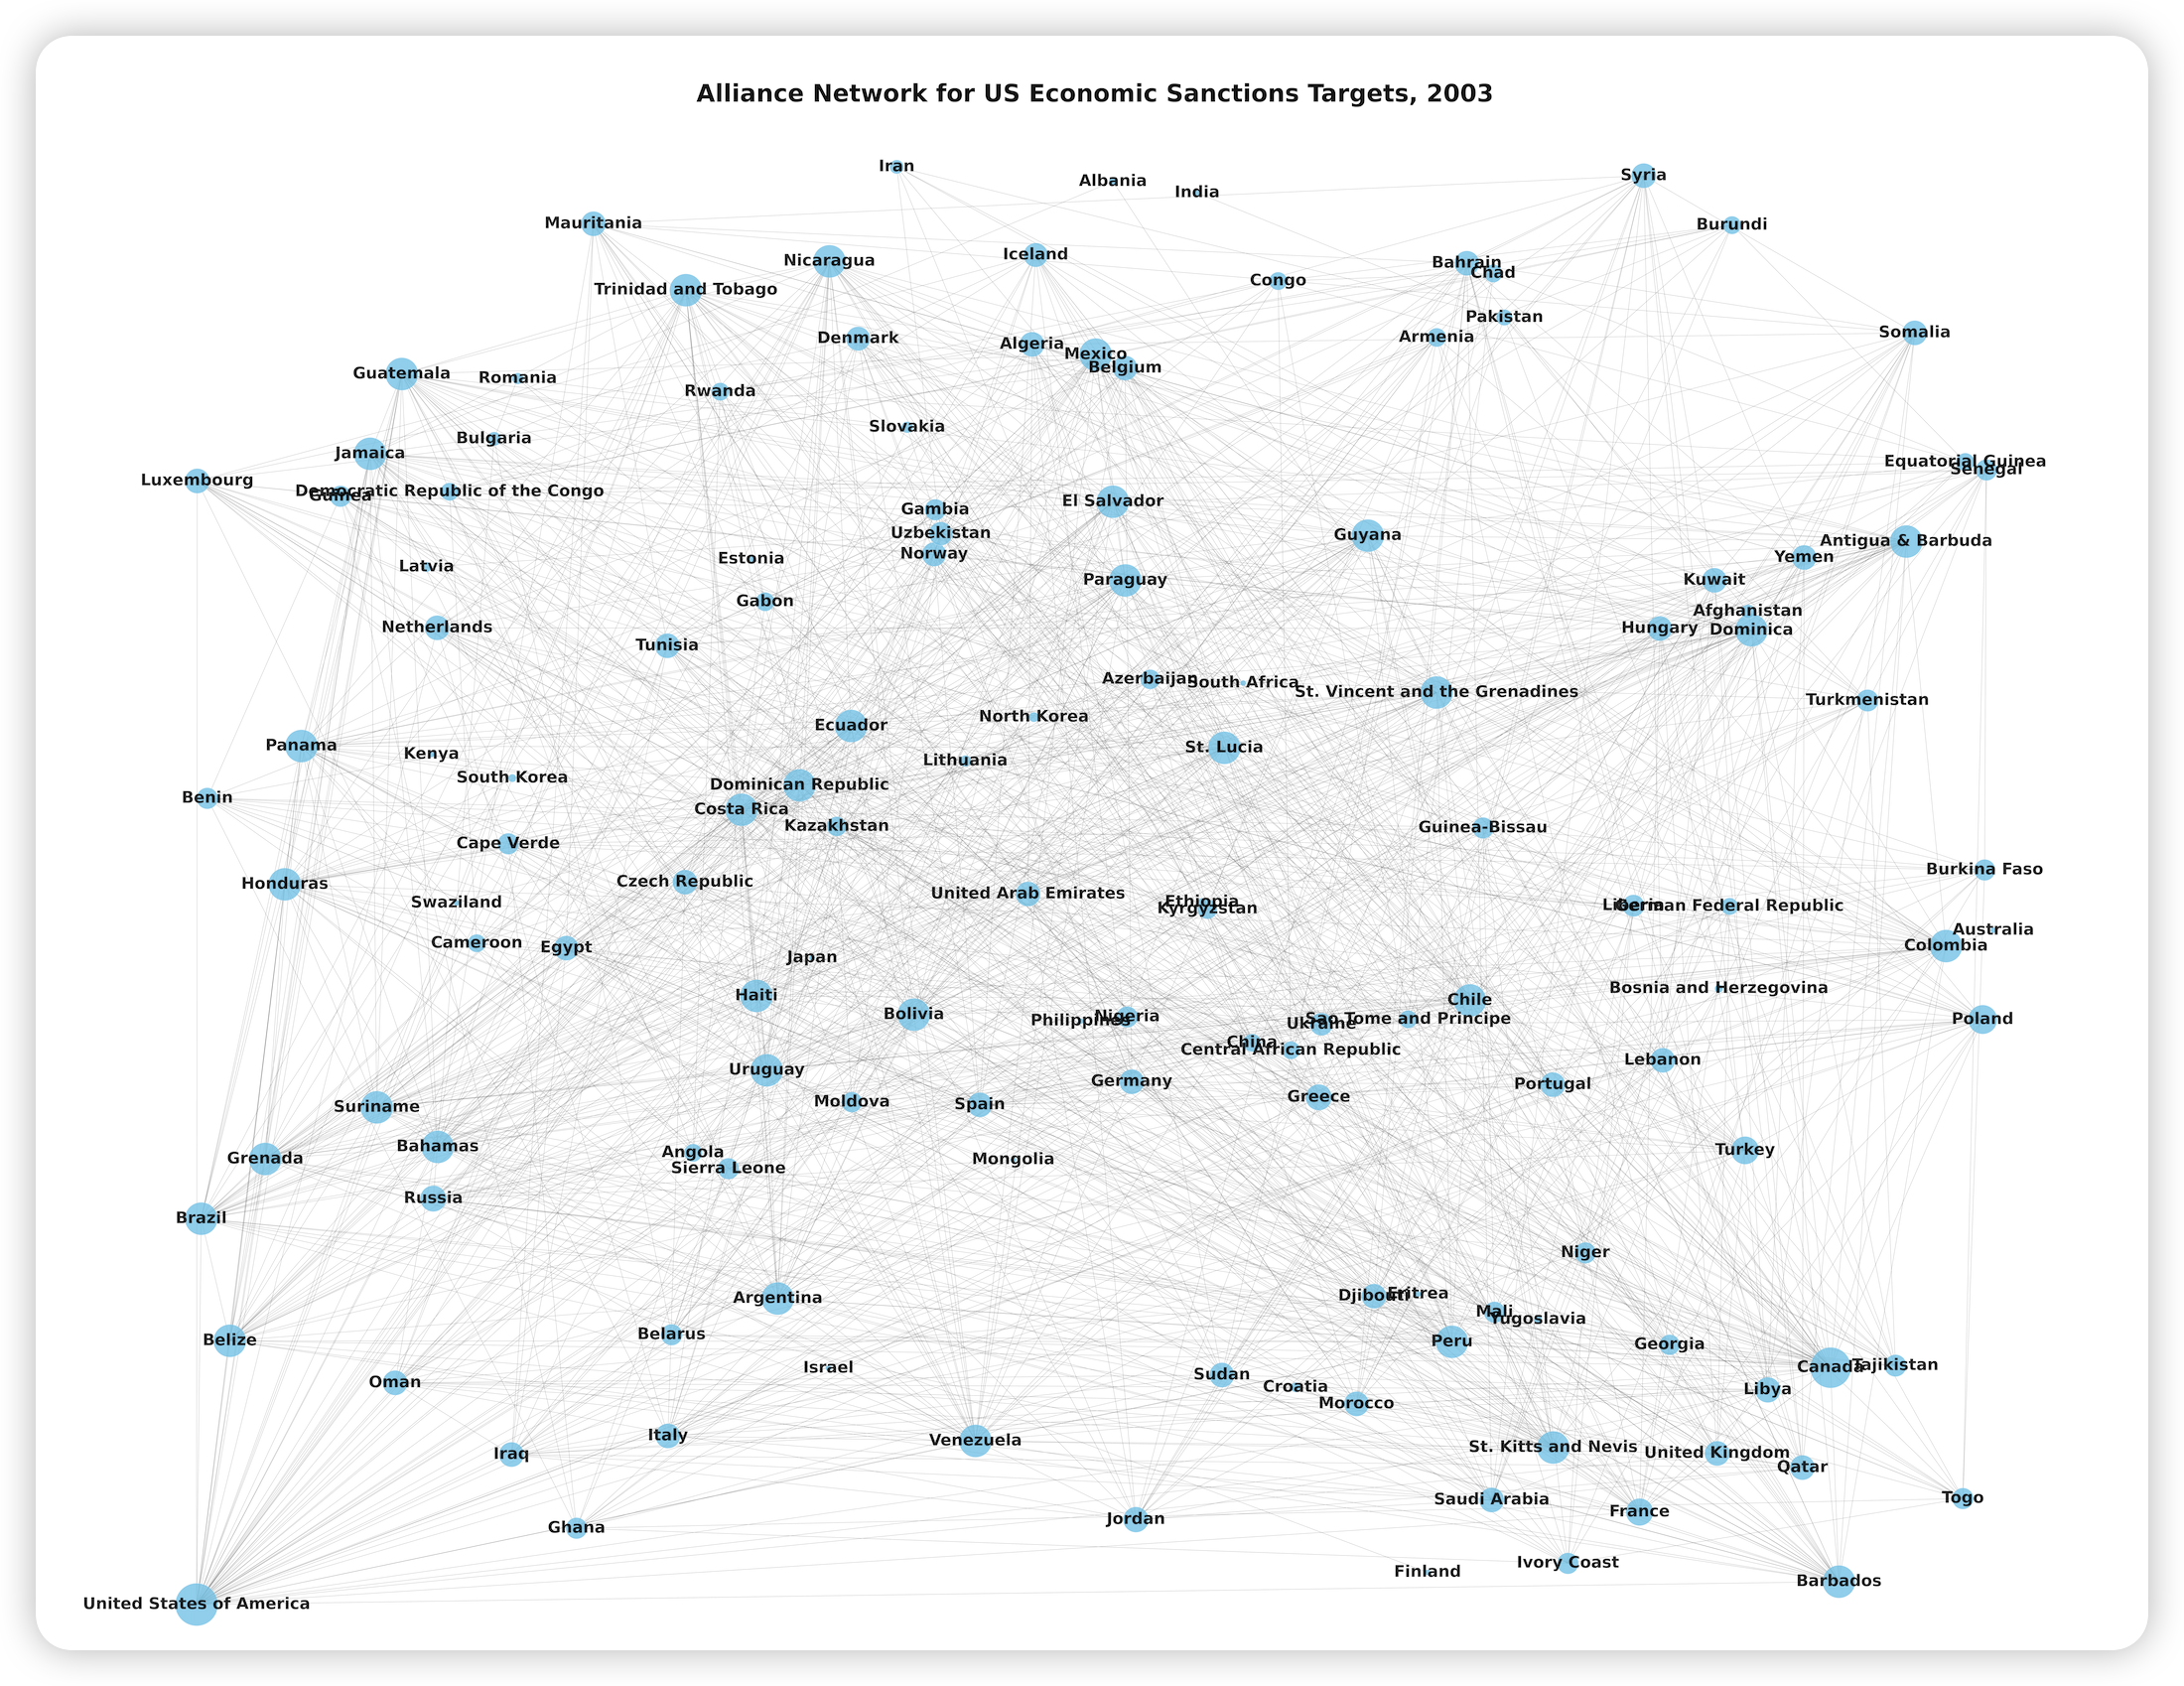
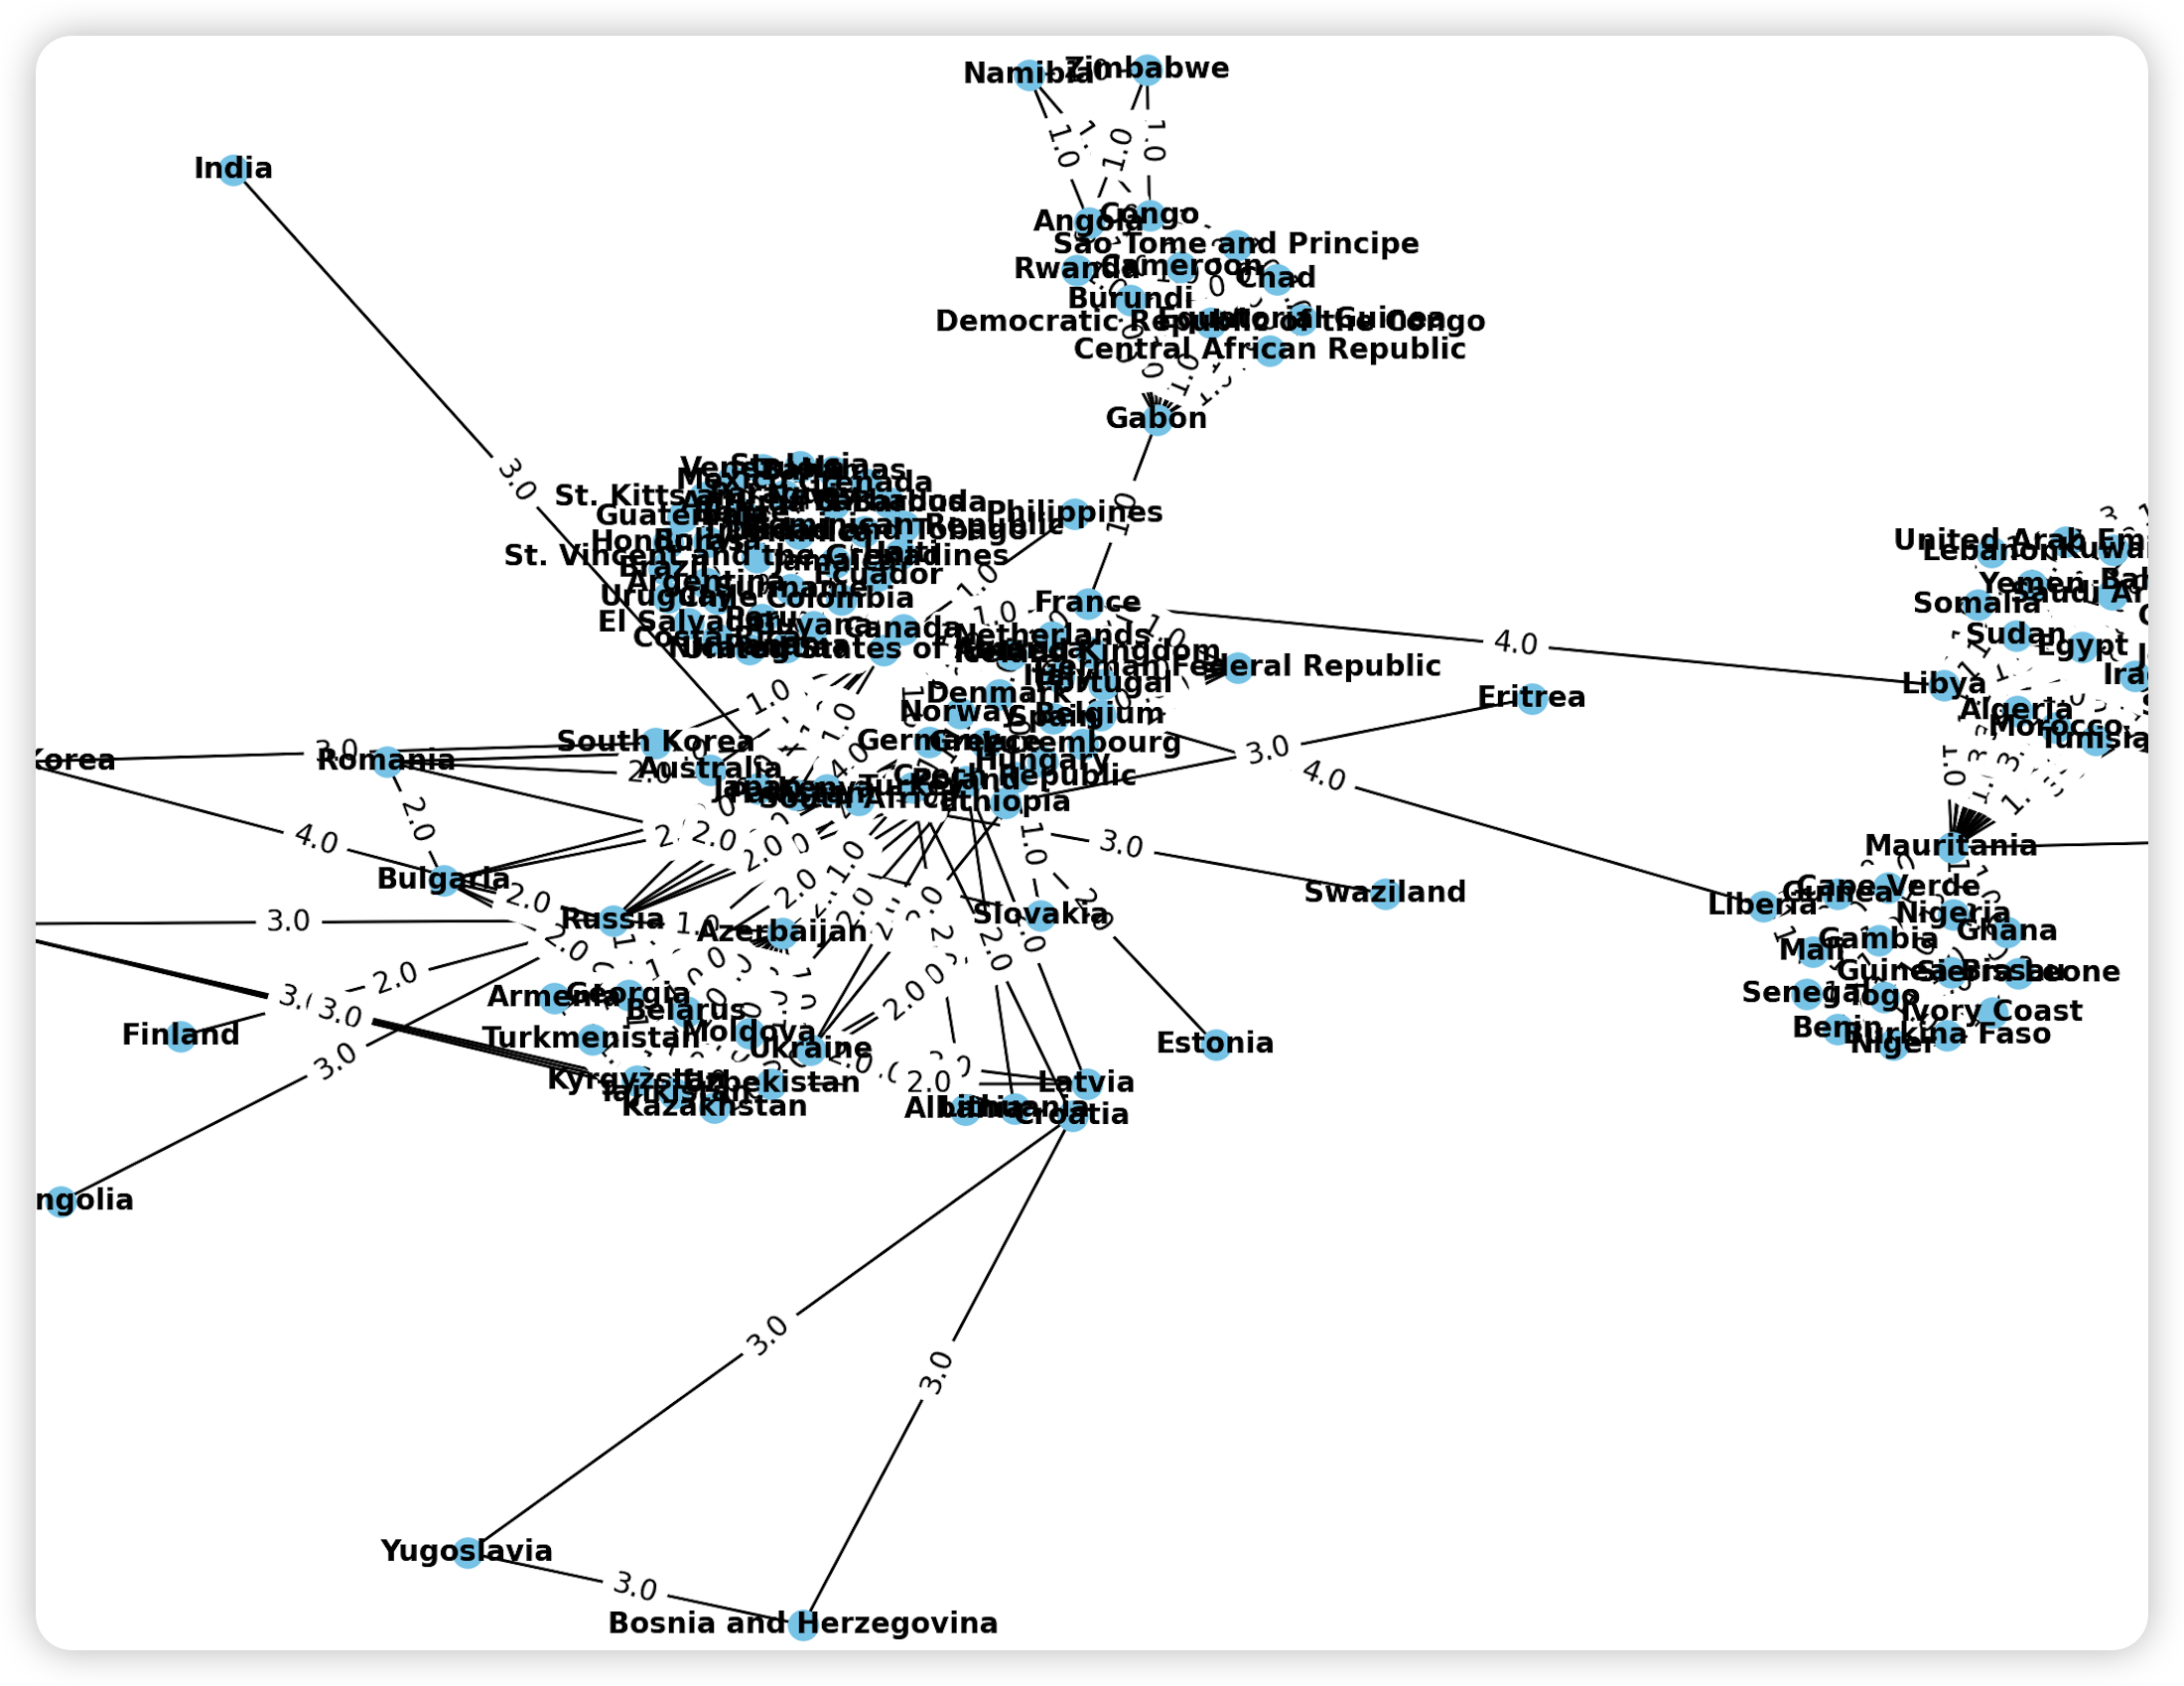
November 11, 2023 Statistics with Python This is the code I used in my MA thesis to create an Alliance Network plot.
import networkx as nx
import pandas as pd
import matplotlib.pyplot as plt
from networkx.drawing.nx_pylab import draw_networkx_nodes, draw_networkx_edges, draw_networkx_labels, draw_networkx_edge_labels
import scipy as sp

f1=open("alliance_dyad_yearly.csv","r",encoding="utf-8")
f2=open("sanctions.csv","r",encoding="utf-8")
txt=f1.readlines()
lst=[]
for i in txt:
    i=i.strip("\n").split(",")
    #print(i)
    m=(i[0],i[1],float(i[2]),float(i[3]))
    lst.append(m)
#print(lst)

sanc=f2.readlines()
lst2=[]
for i in sanc:
    i=i.strip("\n").split(",")
    n=(i[0],i[1],float(i[2]))
    lst2.append(n)
f1.close()
f2.close()


# Create a dictionary to store distances
distances_by_dyad = {'Country_A': [], 'Country_C': [], 'Year': [], 'Distance': []}

# Create graphs for each year
graphs_by_year = {}
for alliance in lst:
    year = alliance[3]
    if year not in graphs_by_year:
        graphs_by_year[year] = nx.Graph()
    graphs_by_year[year].add_edge(alliance[0], alliance[1], weight=alliance[2])

# Calculate distances for each dyad and year
for dyad in lst2:
    country_A, country_C, target_year = dyad
    if target_year in graphs_by_year:
        G = graphs_by_year[target_year]
        try:
            weighted_distance = nx.shortest_path_length(G, source=country_A, target=country_C, weight='weight')
            distances_by_dyad['Country_A'].append(country_A)
            distances_by_dyad['Country_C'].append(country_C)
            distances_by_dyad['Year'].append(target_year)
            distances_by_dyad['Distance'].append(weighted_distance)
        except nx.NetworkXNoPath:
            distances_by_dyad['Country_A'].append(country_A)
            distances_by_dyad['Country_C'].append(country_C)
            distances_by_dyad['Year'].append(target_year)
            distances_by_dyad['Distance'].append(float('inf'))  # or use None for infinity

# Create a DataFrame from the distances dictionary
df_distances = pd.DataFrame(distances_by_dyad)

# Save the DataFrame to a CSV file
df_distances.to_csv('distances.csv', index=False)

# visualization
target_year_plot = 2003
G_plot = graphs_by_year[target_year_plot]
#np.random.seed(42)

pos = nx.random_layout(G_plot, seed=44)
pos['United States of America']=(0,0)

node_sizes=[800*G_plot.degree(node) for node in G_plot.nodes]

edge_weights = [G_plot[u][v]['weight'] for u,v in G_plot.edges]

# Draw the network
plt.figure(figsize=(150, 120))
nx.draw(G_plot, pos, with_labels=True, font_weight='bold', node_size=node_sizes, node_color="skyblue", font_size=80, edgecolors='white', linewidths=1, edge_color='grey', alpha=0.8)

# Draw the labels for edge weights
#labels = nx.get_edge_attributes(G_plot, 'weight')
#nx.draw_networkx_edge_labels(G_plot, pos, edge_labels=labels)


plt.title(f'Alliance Network for US Economic Sanctions Targets, {target_year_plot}', y=0.95, fontsize=120, fontweight='bold', alpha=0.9)
plt.savefig('alliance_network_plot.png')
plt.show()
Preview
#2 FilesRenamer.py
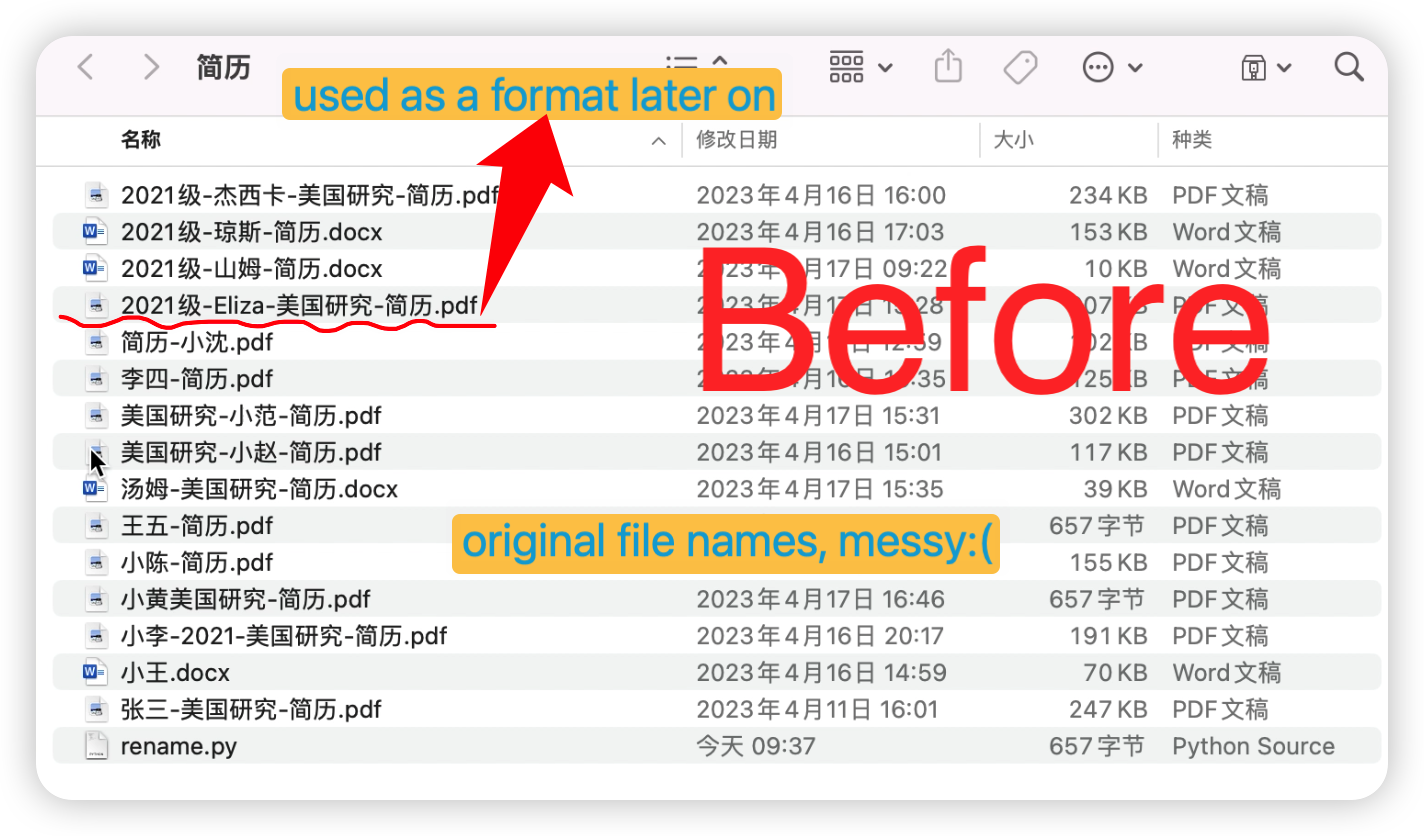
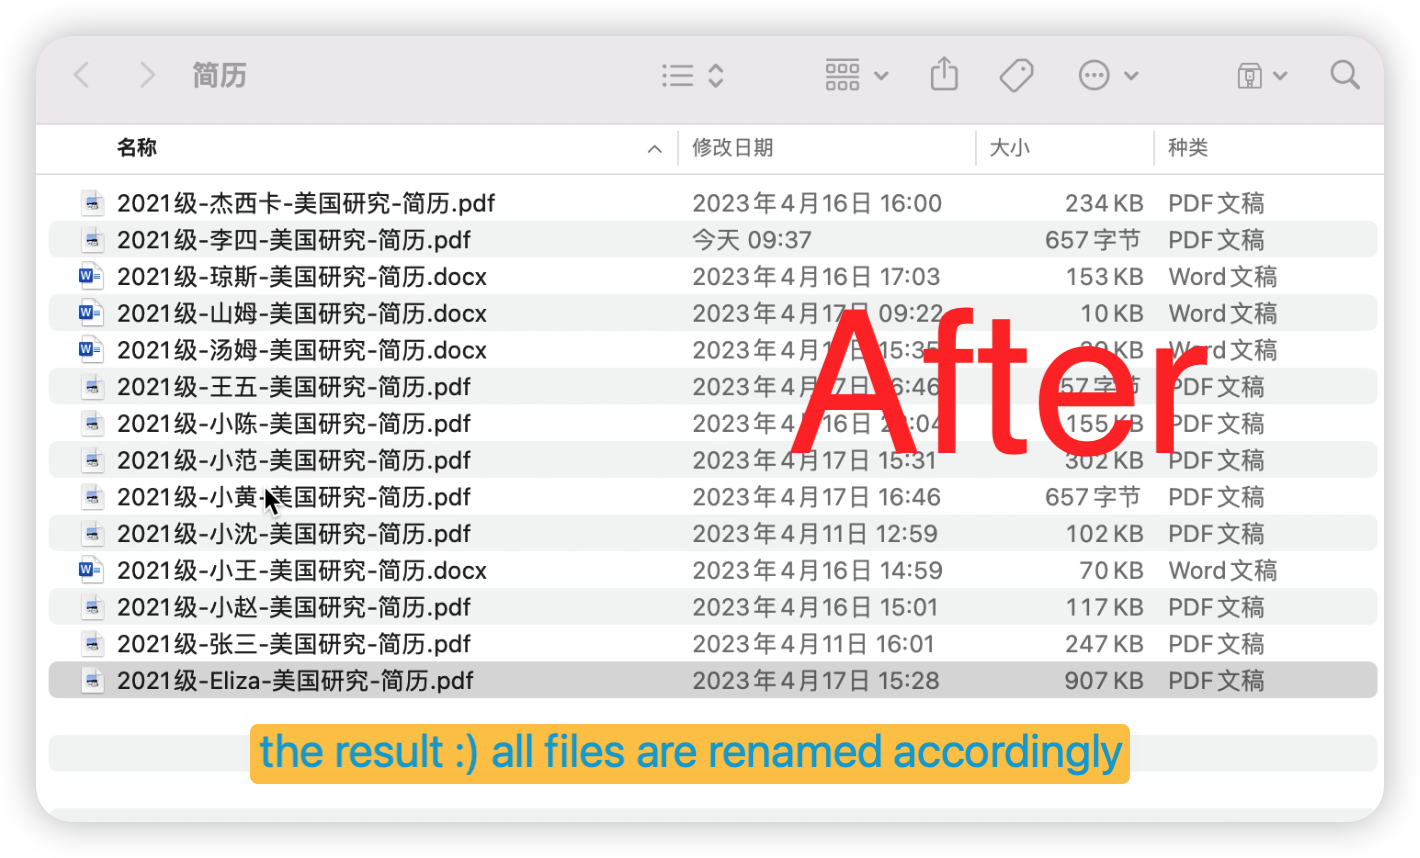
April 17, 2023 Python automation During my experience as the class monitor and TA, I frequently need to gather and submit files. Ensuring proper formatting is essential but often times tedious. So I created this python script to help me automatically formats files as needed.
                import os
                path=input("请输入需要重命名文件所在的文件夹:")
                if os.path.exists(path):
                    fileList=os.listdir(path);
                    n=0;
                    exclude="2021级-美国研究班简历.pdfdocx";
                    for i in fileList:
                        oldname="";
                        oldname1="";
                        for j in fileList[n]:
                            if j in exclude:
                                pass;
                            else:
                                oldname+=j;
                        for m in [".pdf",".docx"]:
                            if m in fileList[n]:
                                newname="2021级-"+oldname+"-美国研究-简历"+m;
                                break;
                            else:
                                pass;
                        os.rename(fileList[n],newname);
                        n+=1;

                else:
                    print("wrong");